Introducing unbox-ai: See Where Your Agent's Tokens Actually Go
unbox-ai opens an AI agent trace as a token treemap, a latency waterfall, and a scrubbable timeline, and gives your coding agent a bounded read-only CLI for the same file. Open source, MIT, one npx command.


Every agent loop has the same shape. Each generation sends the model everything that came before: the system prompt, every tool definition, and the whole conversation so far. When you chat with a coding agent, every new question ships with all the previous ones attached. If you are the one building the agent, you pay for that on every request, and you should know exactly what you are shipping.
Our QA agent produces a trace for every run. When a run was slow or expensive, the trace was the only evidence, and it was unreadable. A run of a few dozen generations exports as a JSON file of a megabyte or more in which the same messages appear over and over. My workflow was to paste the file into a coding agent and ask it to explain the run. A 1.6 MB trace fills most of an agent's context window before it can answer a single question.
So we built unbox-ai. It is the tool we use to debug our own agent, and it is now open source under MIT and on npm:
npx unbox-ai trace.jsonThat one command starts a local server and opens the viewer in your browser. There is no account and no upload. It runs against your trace file, on your machine. It needs Node 18 or newer and reads three trace formats out of the box: gateway exports, opencode session exports, and the .devtools/generations.json database the Vercel AI SDK devtools write. If you build on the AI SDK you can skip the export step entirely and watch runs live, which is covered below.
unbox-ai is not part of the TesterArmy platform. Your tests do not need it and it never sees your runs. It is for anyone who builds an agent and wants to know what that agent sends to the model on every request.
One run, unboxed
Here is a real run of our QA agent testing an app, opened in unbox-ai.
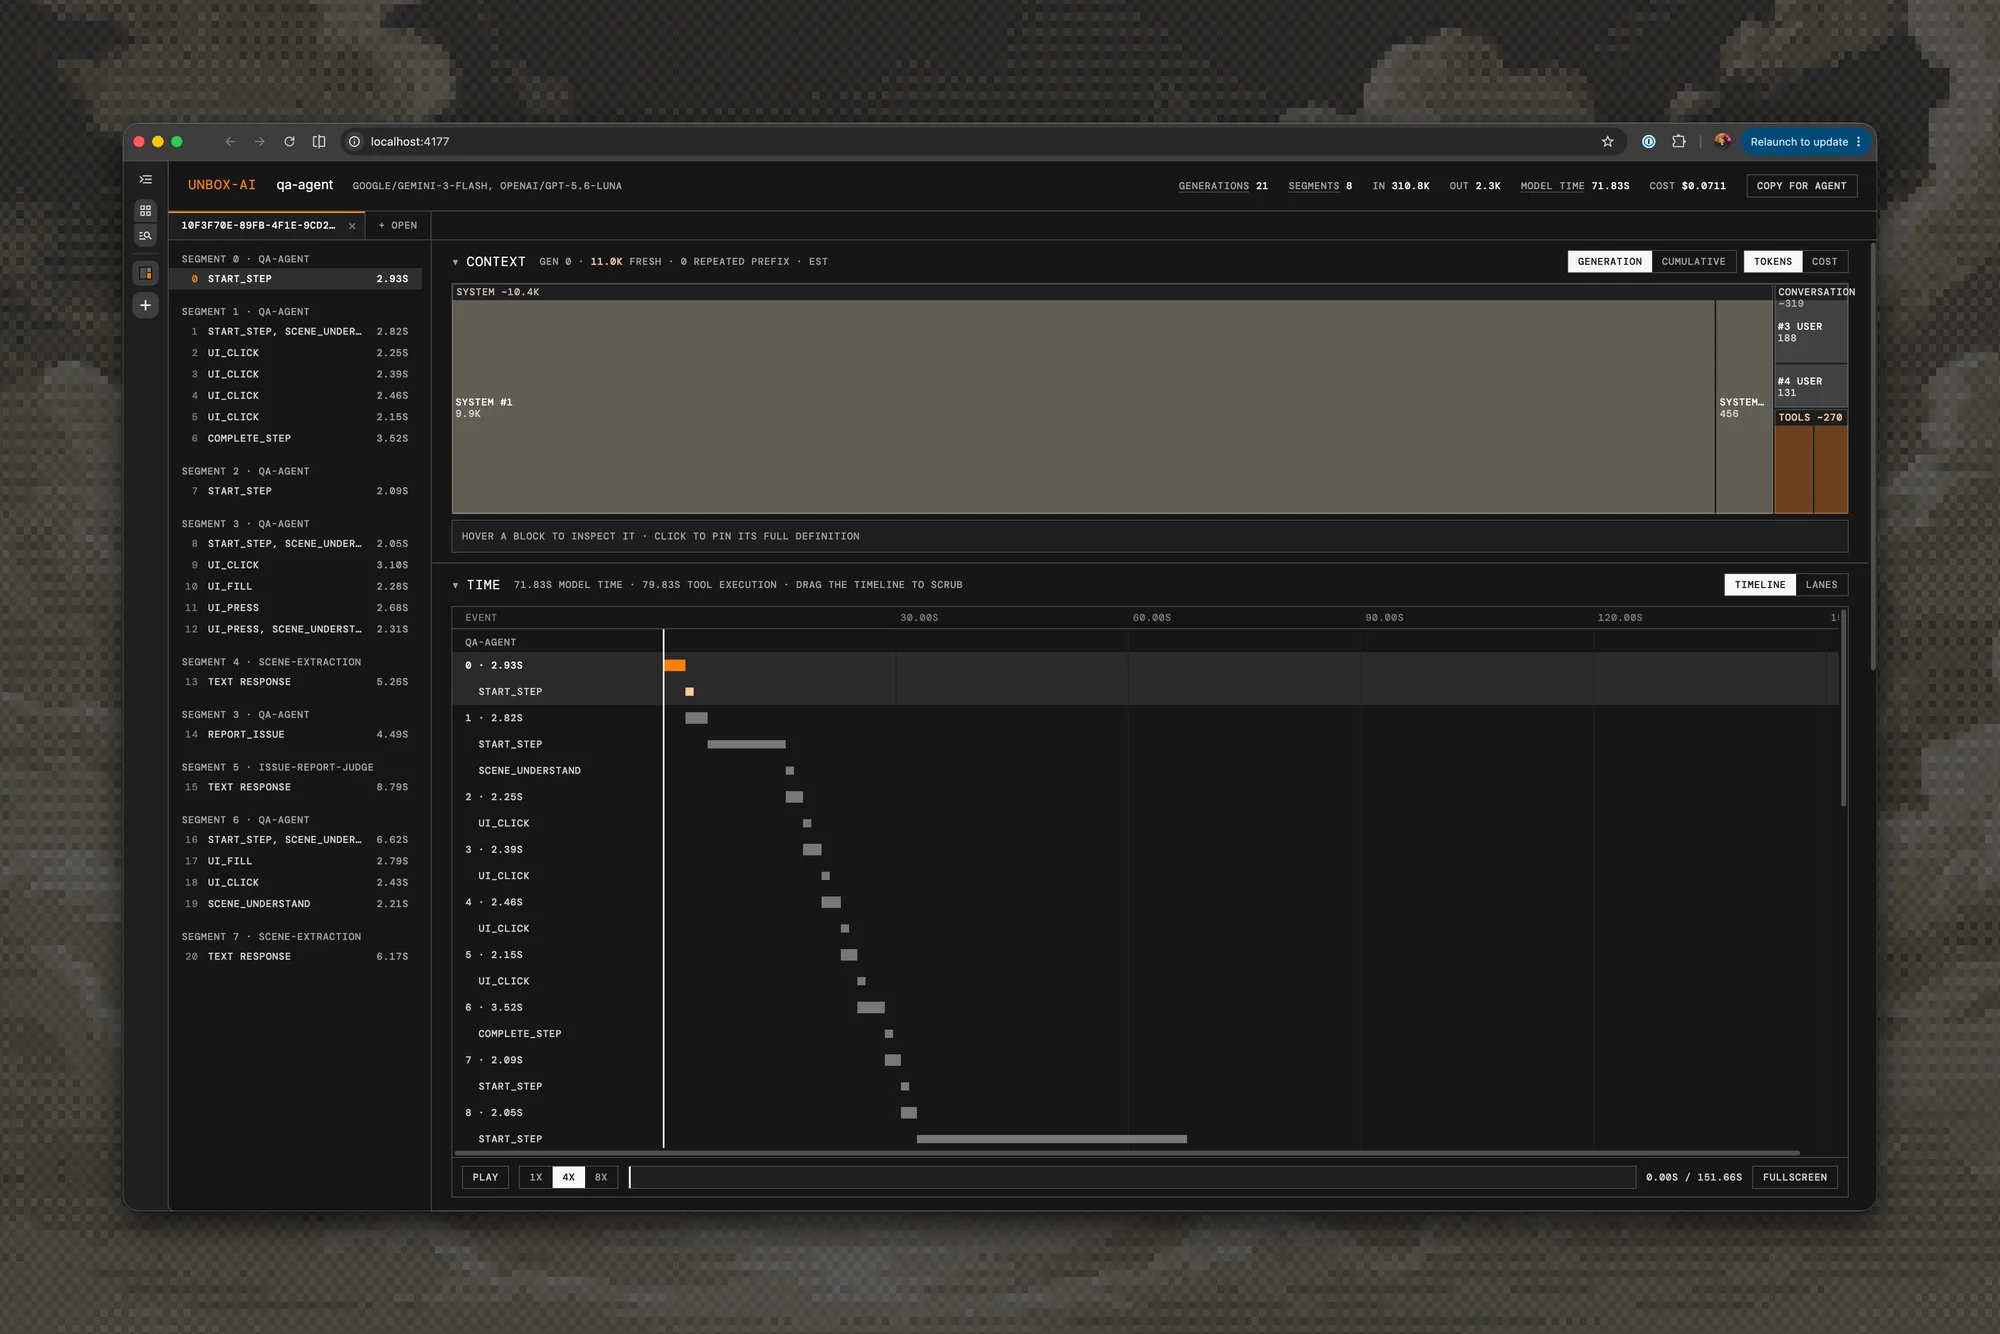
One QA agent run, 21 generations in 8 segments, 310.8k tokens in and 2.3k out, 71.83 seconds of model time, $0.0711.
The header is the run's summary, and two of those numbers explain most agent bills. The run sent 310.8k tokens in to get 2.3k tokens out, a ratio of 135 to 1. Almost everything the model read was context it had already read in an earlier generation.
The sidebar shows the 21 generations split into eight segments across three agents: the qa-agent that drives the app, scene-extraction, and issue-report-judge, running on two models, gemini-3-flash and gpt-5.6-luna. unbox-ai detects conversation resets and interleaved agents in the trace and shows each thread as its own segment, so a multi-agent run reads as the nested thing it is instead of one flat list.
Where the tokens go
The context panel is a treemap of the input tokens of the selected generation, the same idea a bundle analyzer uses to show what bloats a JavaScript build. Every block is attributed to the system prompt, one tool definition, or one conversation message.
Generation 0 in the screenshot is 11.0k tokens. The system prompt is 10.4k of them. The conversation is 319 tokens and the tool definitions about 270. On the first request the agent sends 94% system prompt and under 3% of its own conversation.
Switch the panel to cumulative and each block is weighted by how many times it was resent, which is the number that matches your bill. A tool the agent called once still ships its full definition in all 21 requests, and in the cumulative view it dwarfs the messages that did the work. Switch tokens to cost and the same map is priced per block.
The panel header also tells you how much of the generation was fresh and how much was a repeated prefix. Generation 0 is all fresh. Later generations in a segment are mostly prefix, and when the trace reports cache reads the viewer uses the real numbers instead of inferring them. In one run we opened while preparing this post, a late generation was 97% cached and cost $0.0003. That is what prompt caching is supposed to do, and this is the first place we could watch it happen per request.
Hover a block to inspect it, click to pin its full definition. The screenshot shows a 9.9k-token system prompt as one grey block, and that is all it shows. The prompt text stays in your trace file.
Attribution is estimated. It is character-proportional, scaled to the per-generation totals the trace reports, and the viewer labels it as an estimate.
Where the time goes
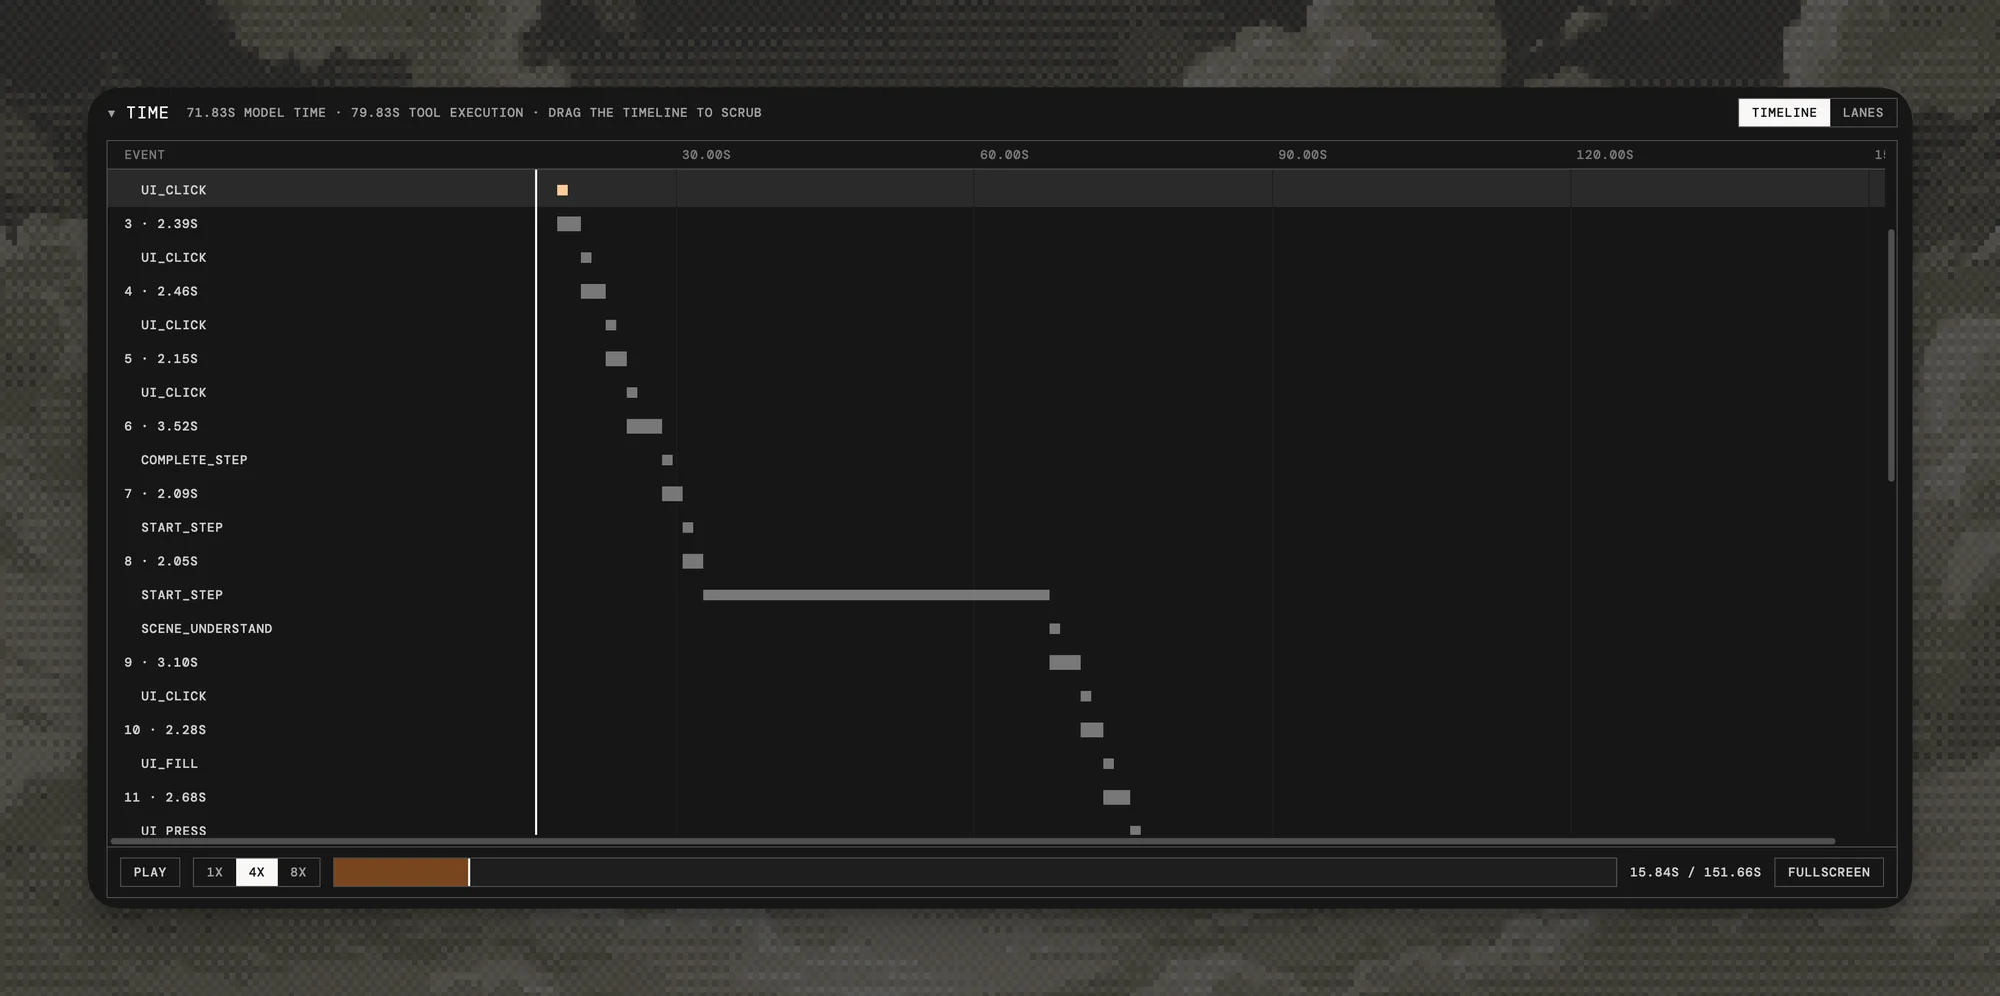
The timeline zoomed into one segment. The long grey bar is a single start_step tool call, more than 30 seconds of the run in which the model was idle.
The time panel is a waterfall. Each generation is a bar with its time-to-first-token mark, and each tool call the generation made is a bar underneath it. The panel header adds the two kinds of time up: 71.83 seconds of model time and 79.83 seconds of tool execution, 151.66 seconds of wall clock in total.
That split surprised us. The model was idle for more than half of the run. The time went to start_step, the tool that begins a new test step, and its longest call held the run for over 30 seconds. No amount of prompt trimming would have made this run faster. The fix is in the tool, and without the waterfall we would have gone looking in the prompt.
Press play and the timeline scrubs through the run at 1x, 4x, or 8x while the context panel and the generation detail follow the playhead. You watch what the agent did and what it was looking at, generation by generation. Drag the playhead to any point to stop and read.
Only what is new
Click a generation in the sidebar and you see only the messages that are new since the previous generation, with each tool call paired to its result. The 21 copies of the system prompt collapse into one. Raw JSON is one click away when you need the exact bytes.
unbox-ai view a.trace.json b.trace.json opens several files (any mix of formats) as one run list with a tab per file. Dropping another .json anywhere in the window opens it too.
The CLI is for your coding agent
This is the part we use every day. The viewer is for you. The CLI is for the agent you debug with.
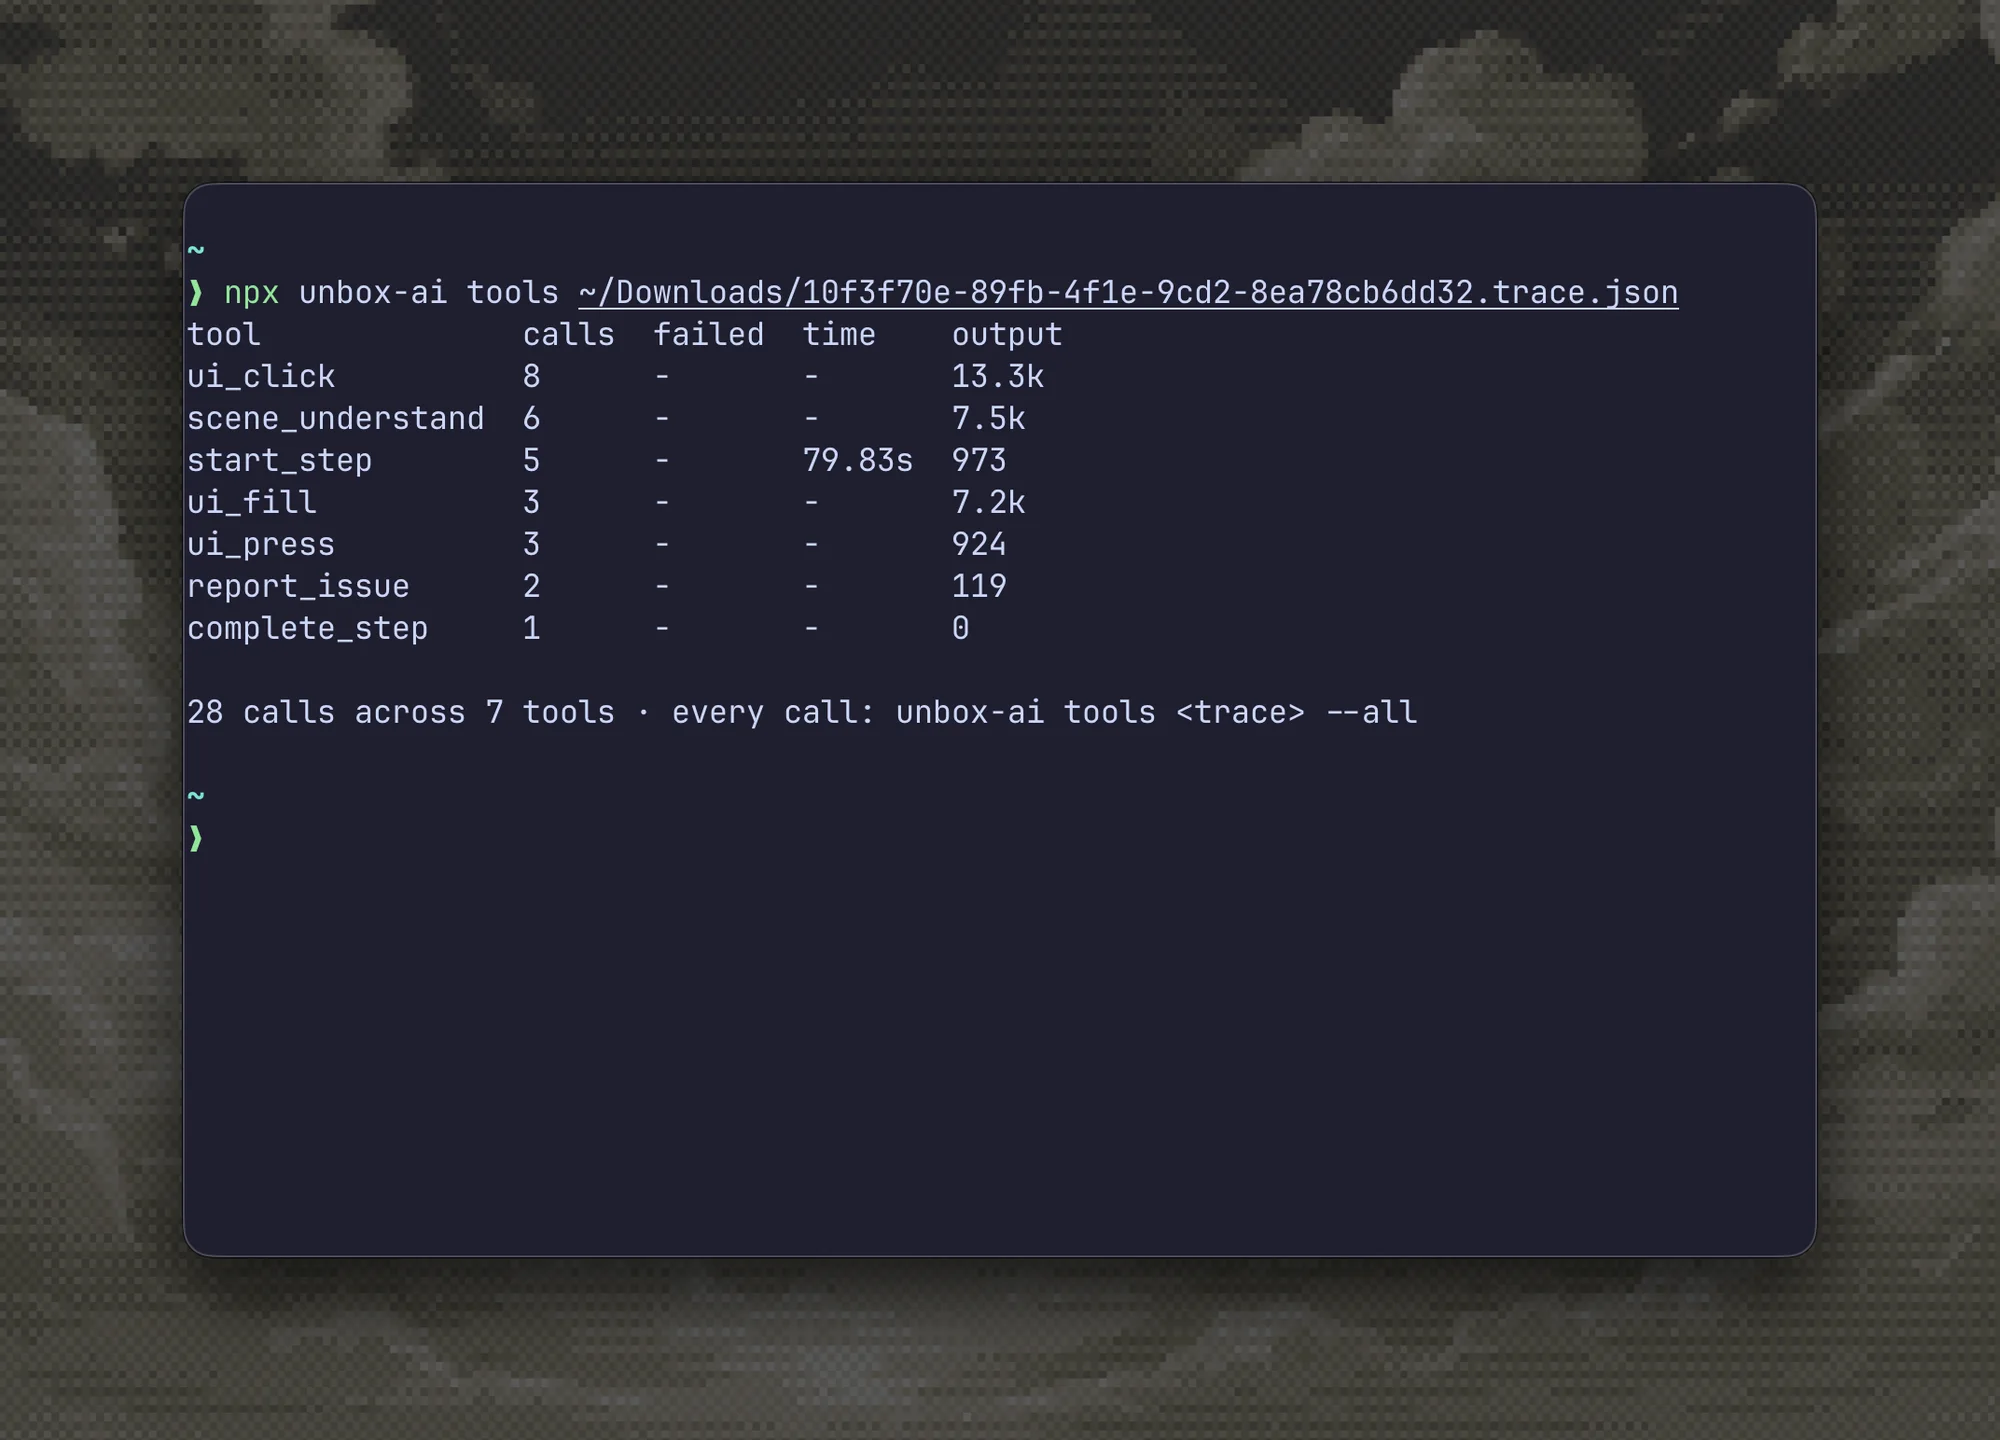
unbox-ai tools on the same trace. Call counts, failures, execution time, and output size per tool, in 12 lines.
That one command tells you the agent clicked 8 times, filled 3 fields, read the screen 6 times, and filed 2 issues. Nothing failed. All 79.83 seconds of tool time sit in start_step. The last line prints the exact command that returns every individual call with its arguments.
Every command is read-only and caps its output. When a command truncates, it prints the exact get invocation that returns the rest, so the agent follows pointers instead of guessing paths. When stdout is not a TTY, bare unbox-ai trace.json prints the summary instead of starting a server, so an agent never spawns one by accident. That makes the whole binary safe to allowlist.
unbox-ai summary trace.json          # totals + one line per generation
unbox-ai summary trace.json --by model
unbox-ai events trace.json           # table: tokens, latency, cost, tool calls
unbox-ai event trace.json 5          # one generation, new messages only
unbox-ai tools trace.json            # every tool: calls, failures, time, output size
unbox-ai messages trace.json --grep "error" --role assistant --limit 10
unbox-ai get trace.json 'events[5].messages[10].tool_calls[0]'
unbox-ai compare a.json b.json       # A/B two runs
unbox-ai summary trace.json --json   # any command, machine-readable
So when a run fails, we no longer paste JSON into Claude Code. We say "figure out why this run was slow" and the agent runs summary, checks tools, drills into the suspicious generation with event, greps the messages, and fetches full values through the printed get pointers. Bounded output means it never floods its own context window doing so. The agent explores the trace the same way you explore the dashboard.
That turns trace review into a loop. The agent reads the run, proposes a change to the prompt or a tool, you rerun, and it reads the new run. We built TesterArmy to close that loop for testing apps. unbox-ai closes a smaller version of it for the agent itself.
A ready-made agent skill ships in the repo with the full workflow and analysis recipes:
npx skills add tester-army/unbox-ai -gPrefer zero setup? Drop this in your AGENTS.md:
To inspect AI trace files, use `npx unbox-ai` (read-only, bounded output):
`unbox-ai summary <trace>`, then `unbox-ai event <trace> <idx>` to drill in,
`unbox-ai messages <trace> --grep <re>` to search, and the printed `get`
pointers to fetch full values.
The viewer meets the CLI halfway. The "copy for agent" button in the header copies the exact summary command for the run on screen, so you can hand your agent whatever you are looking at.
Compare two runs
Our agent does the same job hundreds of times a day: open an app, run the test plan. Two runs of the same task should look alike, and when they do not, the difference is either the bug or the win.
unbox-ai compare a.json b.json answers "what changed and what did it buy". It prints token, cost, time, and cache deltas, a diff of the task (differing tasks make every delta misleading), per-tool usage deltas, then a line diff of the system prompt and the tool-set changes: added and removed tools, and for each changed tool whether the description or the schema moved. Add --trajectory for an action table that aligns the two tool sequences and marks exactly which steps differ, so an extra step in one run does not shift everything after it.
We lean on this constantly. Trim a tool description, run the same test, compare. Swap the model, compare. Compare the first run of a test with the twentieth to see where the agent drifted. Two runs from one devtools database work too: unbox-ai compare db.json --run 0 --run 1. The viewer has the same thing interactively: with two or more runs open, a compare button opens a side-by-side trajectory where each aligned generation expands into both runs' messages.
Live view for AI SDK apps
If you build on the Vercel AI SDK, unbox-ai devtools is a drop-in replacement for the @ai-sdk/devtools viewer. Instrument your app exactly as the AI SDK documents it:
import { registerTelemetry } from "ai";
import { DevToolsTelemetry } from "@ai-sdk/devtools";

registerTelemetry(DevToolsTelemetry());
Then instead of npx @ai-sdk/devtools, run:
npx unbox-ai devtoolsEvery generateText and streamText call streams into the viewer live. Each run gets its own entry in the sidebar, nested agent runs (tools that call the AI SDK again) indent under their parent, and the viewer follows the newest run until you pin one. You watch the treemap and the waterfall grow while your agent runs, which is a different experience from exporting a trace after the fact.
Trace formats
unbox-ai auto-detects three formats today:
- Gateway exports. JSON with
events[]of generations carrying metrics, tools, and cumulative message snapshots. Conversation resets and multi-agent interleaving show up as segments. - opencode session exports. Adapted automatically, with real cache read and write tokens and per-tool execution times.
- AI SDK devtools databases (
.devtools/generations.json). Adapted automatically and served live byunbox-ai devtools.
There is no universal AI-trace standard yet. The closest candidates (OpenTelemetry GenAI conventions, OpenInference, OpenLLMetry) are all span-based. Adapters are deliberately small: implement detect and adapt in one file and register it, with the opencode adapter as the reference. If your stack exports traces in another shape, an adapter is the contribution we want most.
Try it
If you run agents in production, you have trace files sitting around right now. Point the viewer at one:
npx unbox-ai trace.jsonOur bet is that the first treemap surprises you. It surprised us, and we wrote the agent.
The code is at github.com/tester-army/unbox-ai. Issues and adapter PRs welcome.